Assessing the Relative Resilience of the Coral Reefs of St. Croix, U.S. Virgin Islands
Location
St. Croix, U.S. Virgin Islands (USVI)
The challenge
Coral reefs have always been dynamic habitats in which episodic disturbances occur and set the reef growth clock back, followed by periods in which the system recovers. Under these conditions coral reefs have evolved to be resilient habitats – they can recover and maintain ecosystem function after disturbances – but this natural resilience of reefs is now being undermined. Reefs face unprecedented pressures so managers and conservationists have to support and build resilience when and where possible. As a conceptual framework, resilience has been hugely popular with conservationists but ‘operationalizing’ resilience in a management setting has been difficult. Managers can reduce stress, support recovery processes, and educate and raise awareness, but need information that helps to support these actions. This case study describes how assessments of relative resilience can be used to target and tailor management actions.
This is one of the first large-scale assessments of relative resilience to use a short-list of indicators from McClanahan et al. 2012 and follows some of the guidance provided by Maynard and Mcleod 2012. The output of the analysis is an assessment of spatial variation in relative resilience (high, medium, or low) in combination with an assessment of relative levels of anthropogenic stress (high, medium, or low). Managers and conservationists can use the analysis outputs to support efforts to achieve conservation outcomes, like planning marine protected area networks, targeting actions to reduce stress, and educating and engaging with stakeholders and community members. In this project in the U.S. Virgin Islands (USVI), the project leaders hoped to use the resilience assessment to meet the following objectives:
- Identify sites with high resilience that are not currently inside marine protected areas (MPAs).
- Assess threats at sites with high and low resilience to target conservation effort.
- Develop materials to aid in educating and engaging about the importance of Buck Island and east end MPAs.
- Prioritize sites for the transplantation of nursery-grown corals.
Actions taken
The process used to complete the analysis is the same process explained in the Resilience Analysis Tutorial. Project leaders and the The Nature Conservancy (TNC) Resilience Committee for USVI decided which resilience indicators to include in the analysis through a consultative process. Project leaders developed a spreadsheet containing all 30 of the resilience indicators described in the McClanahan et al. (2012) review. The case was made to the Committee that indicators not in the top 20 for perceived importance and strength of evidence should be excluded. This first suggestion was agreed upon; the rationale being that each additional indicator included dilutes the relative importance of each of the other indicators. In other words, a shorter list of indicators that are important to resistance properties and resilience processes is better than a longer list that includes weak indicators. The remaining indicators were then classified into three tiers based on data availability and perceived importance to resistance and resilience in USVI. The final indicators used were: resistant species, coral diversity, herbivore biomass, macroalgae cover, coral cover, temperature variability and coral disease. The anthropogenic stressors examined were fishing pressure and coastal development.
The data were collected and compiled via a combination of fieldwork and desktop analysis undertaken under the Territorial and National Coral Reef Monitoring Programs (TCRMP and NCRMP) by staff from TNC, the National Oceanic and Atmospheric Administration’s Coral Reef Conservation Program (NOAA CRCP), Department of Planning and Natural Resources Division of Fish and Wildlife (DPRN-DFW), and NOAA’s National Centers for Coastal Ocean Science Biogeography Branch or by this report’s authors. A relative resilience score is calculated as follows. For all 7 resilience indicators, the scores for all sites (n=267) are ‘anchored’ to the maximum score by dividing the value for each site for the indicator by the maximum value among all sites. Anchoring values produces a score for each site on a standardized 0-1 scale, which expresses the value for each site relative (as a percentage) to the maximum value. Before anchored scores for all indicators can be averaged, the anchored scores for macroalgae and coral disease are subtracted from 1, which ensures the standardized 0-1 scale is uni-directional in that a high score is always a good score. The scores are then averaged to produce the resilience score and then these scores are also anchored to the maximum score to produce a final resilience score that expresses the ‘assessed resilience’ as relative to the maximum resilience score. The same approach is used for the proxies of anthropogenic stress, which are kept separate to the resilience scores. The values are anchored for all sites for each proxy to the maximum value and then the values are averaged and re-anchored to produce the final stress score. For stress, high scores mean high stress. For both resilience and anthropogenic stress, a high, medium and low scale is used based on the following data ranges: 0.8-1.0 for high, 0.6-0.79 for medium and <0.6 for low.
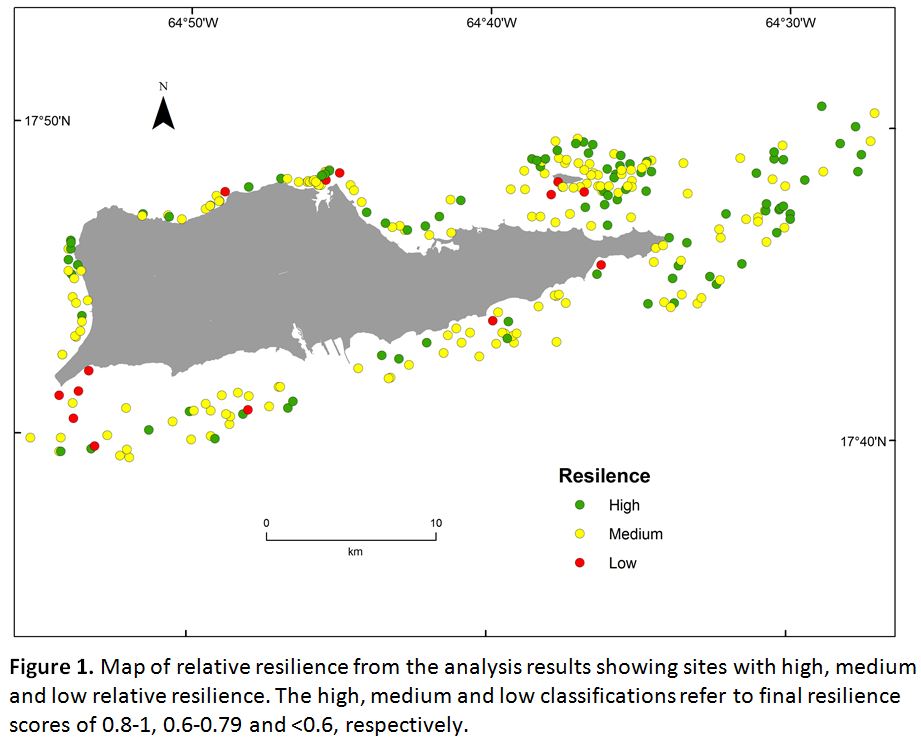
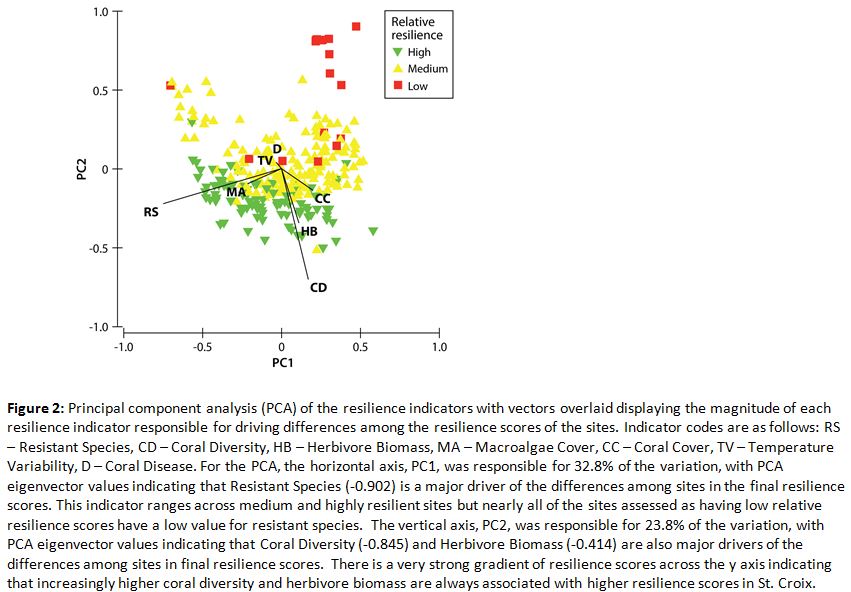
Sites are ranked from highest to lowest resilience (from 1 through to 268). Resilience scores are presented spatially on two maps; one that uses a 3-bin stoplight color system of green, yellow and red for high, medium and low, respectively (see Figure 1), and another that sets resilience scores into 10 equal (0.10) bins. Principle Components Analysis (PCA) is used to identify commonalities among the scores for the various indicators for high, medium, and low resilience sites; i.e., whether some resilience indicators more greatly influenced the final rankings and in what way (see Figure 2). The results were then shared with managers and stakeholders to identify and prioritize potential follow-on actions.
How successful has it been?
All of the set objectives were met by the analysis or will be met over the coming months by using analysis outputs to engage with stakeholders and community members. It is not anticipated that this analysis will be used to create additional Marine Protected Areas right now. However, the results may be used to review MPA placement in the future and will inform a range of other management actions over the coming years that will support the resilience of St. Croix’s reefs. As an example, preliminary data suggests there is a positive and significant correlation between the resilience score from this analysis and known spatial variation in the survivorship of transplanted corals. The analysis results will now be used to determine where nursery-grown corals are most needed and have the greatest potential for restoration success. The analysis will be extended in the coming year to include reefs near St. Thomas and St. John to better target conservation effort across all 3 islands.
How successful has it been?
- Resilience assessments can be completed as a desktop-exercise using existing data (the case here).
- The most critical first step is the identification of clear objectives.
- The process of selecting indicators collaboratively ensures partners and stakeholders are intellectually invested in the assessment.
- Collaboration generated through the consultations used to select indicators increases buy-in, which maximizes uptake of the analysis outputs.
- Resilience assessments including multiple sites and indicators require investing effort in data management. Data need to be in one location and all data for indicators needs to be standardized such that comparisons can be made among sites.
- Maps describing the relative resilience of sites and graphs describing the relative influence of each of the indicators on the final rankings help to simply and visually explain the analysis and its value to partners and stakeholders.
- The completion of a desktop-based resilience assessment will identify ways field monitoring programs can be modified to collect more or better information on resilience indicators. The exercise may also help to identify better ways of storing field data such that future resilience assessments can be completed quickly and less resource-intensively than the first.
Funding summary
This project was funded by The Nature Conservancy through its office in St. Croix, USVI and in partnership with NOAA’s Coral Reef Conservation Program.
Lead organizations
The Nature Conservancy
Partners
NOAA Coral Reef Conservation Program
NOAA NCCOS Biogeography Program
NOAA National Coral Reef Monitoring Program
USVI Department of Planning and Natural Resources
USVI Division of Fish and Wildlife
Resources
Assessing and Monitoring Reef Resilience
Selecting Resilience Indicators
Northern Mariana Islands Resilience Assessment Case Study
How-to Guide for Conducting Resilience Assessments
Prioritizing Key Resilience Indicators to Support Coral Reef Management in a Changing Climate
Operationalizing Resilience for Adaptive Coral Reef Management Under Global Environmental Change