
Ecological Resilience Assessments
Resilience indicators are those for which there is strong evidence of a link to the capacity of corals or a coral community to resist impacts or recover from disturbances, and indicators that can reliably be measured or assessed. Scientists have prioritized the following indicators and anthropogenic stressors as likely to be the most important to supporting the resilience of coral reef ecosystems:
| Resilience indicators | Description | Possible methods | Common units |
|---|---|---|---|
| Resistant coral species | Proportion of the reef-building coral community made up by species that have demonstrated or are thought to be relatively resistant to thermal coral bleaching (Marshall and Baird 2000; McClanahan et al. 2004). | Timed swims, quadrats, belt transects, point-intercept transects | % of community |
| Coral diversity | A quantitative measure that reflects how many different coral species there are in a dataset, while simultaneously taking into account how evenly the species are distributed. Common indices express the probability that two species selected at random from a community will be different. | Indices: Shannon or Simpson's Index | Unitless |
| Herbivore biomass | Weight per unit area of herbivorous fish and invertebrates. can be inclusive of all major herbivore functional groups (scrapers, grazers, excavators, browsers) or can separate these. | Timed swims, belt transects, stationary point counts | kg/100m2, g/m2 |
| Coral disease | Proportion of the coral community that is affected by diseases. You may choose to use a ‘total prevalence’, which combines all diseases and all corals, or a subset of diseases or corals to assess effects from a particular disease or on a particular coral. | Belt transects | % (of colonies affected; a 'total prevalence'; i.e., all or a subset of diseases combined) |
| Macroalgae cover | Percent of substrate taken up by fleshy macroalgae (>5cm high). | Quadrats, photo quadrats, belt transects, point-intercept transects | % benthic community |
| Recruitment | Abundance and density of recently settled corals that are less than 2 years old. | Quadrats | #/m2 |
| Temperature variability | Variability of temperatures during the warm season. Higher variability has been associated with bleaching resistance. | Remotely sensed, available for all coral reefs at 4-km resolution from NOAA remote sensing archives | Unitless |
| Herbivore diversity | See 'coral diversity' description; same for herbivorous fish and invertebrates. Can also be assessed as the number of key herbivore functional groups present at a minimum abundance (e.g., scrapers, grazers, browsers and excavators). | Timed swims, belt transects, stationary point counts | Unitless (diversity indices), or number present at a minimum abundance |
| Habitat/structural complexity | Three-dimensionality of the substrate and crack and crevice depth and diversity. Ratio of reef surface contour distance to linear distance. | Chain over substrate | m |
| Mature colonies | Proportion of the benthic community made up by long-lived corals (i.e., >10 years old). | Timed swims, belt transects, stationary point counts | % of community |
| Light (stress) | Amount of light per square meter reaching the substrate during typical oceanographic conditions during the warm season. | Requires instrumentation | watts/cm2 |
| Coral size-class distribution | Evenness of corals within a range of size classes that includes recruits and mature colonies. | Timed swims, quadrats, belt transects, point-intercept transects | Unitless |
| Substrate suitability | Ratio expressing available substrate for coral recruits as being suitable and unsuitable for coral settlement. | Timed swims, quadrats, belt transects, point-intercept transects | Unitless |
The following anthropogenic stressors can also be used as key resilience indicators:
- Nutrients (pollution)
- Sedimentation
- Physical human impacts
- Fishing pressure
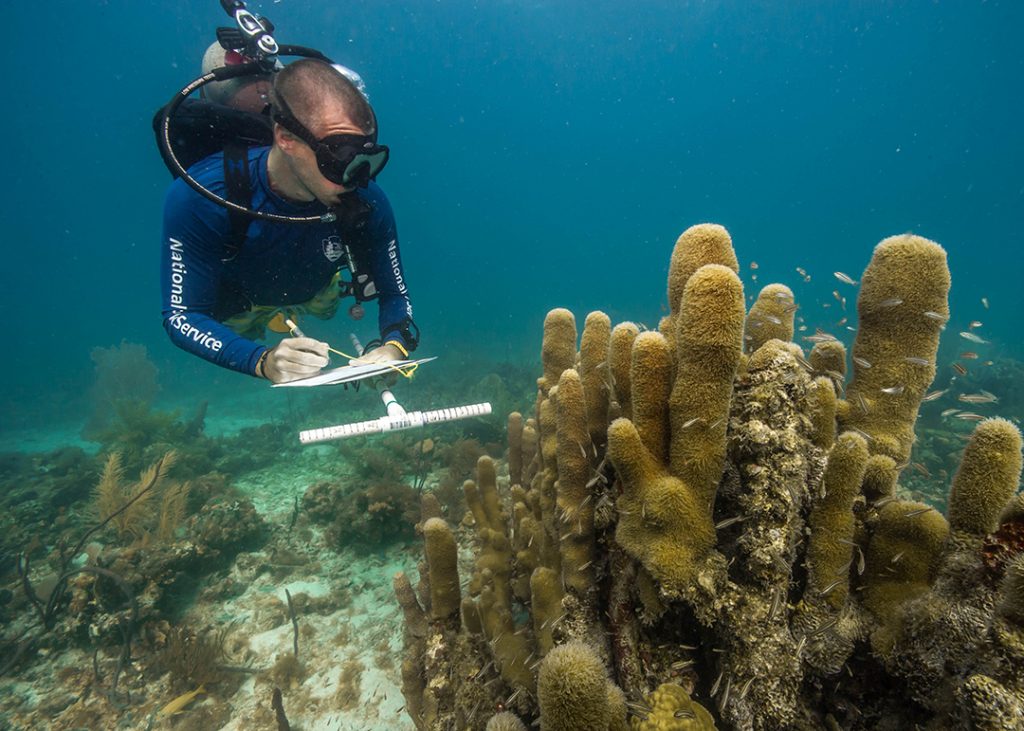
Diver on a monitoring dive in the Florida Keys. The striped pole is used to estimate distance and sizes of fish, corals, or other reef organisms. Photo © Shaun Wolfe/Ocean Image Bank
While the list of indicators above may be used to help managers prioritize which ones to include in a resilience assessment or monitoring program, it is also useful for managers to review key publications to identify additional indicators to use in their local context. ref