Stock Assessment Methods
Fisheries play a critical role in the livelihoods of millions of people. Small-scale fisheries (generally defined as harvesting landings smaller than 10,000 tons per year) play an important role in local economies. In the developing world, most of the catch comes from fisheries that are overfished and poorly managed, because even the most basic information on how the fish stocks are doing and how hard they are being fished is unavailable. The lack of data on fish population sizes, fishing effort, and level of fishing pressure that fisheries can support is also a problem for global fisheries; 60% of the world's fish catch is unassessed. Such data are essential for effective management.
A stock assessment provides information to guide fishery management by allowing managers to detect changes in the condition of fish stocks over time. These changes may trigger a management response, aimed at meeting one or more target objectives of the fishery. For example, if managers assess a stock and detect that too many juvenile fish are being harvested, leaving the stock with a low reproduction potential, managers can use this information to set limits on catch or size of the fish being caught.
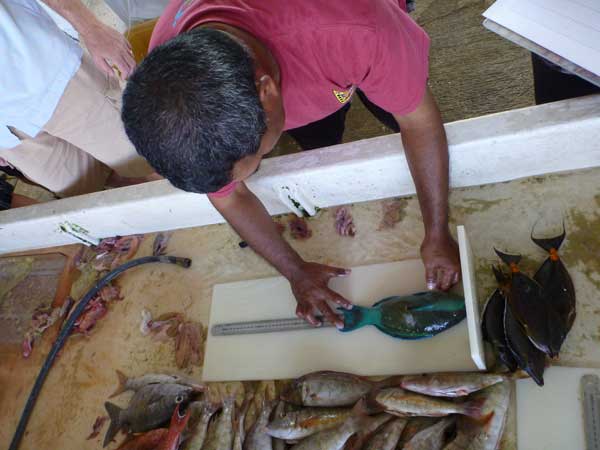
Measuring fish length as part of the Palau Stock Assessment Project. Photo © Andrew Smith
Many methods exist for assessing coral reef fisheries, ranging from conventional statistical methods that quantify biomass levels and estimate maximum sustainable yield (MSY), to methods that can be applied where fishery data are limited. When fishery data are limited, proxies can be used to estimate biomass or fishing mortality.
Traditional stock assessments (such as an age structure population model) require large quantities of data, funding, and capacity to be carried out. A traditional stock assessment can cost hundreds of thousands of dollars, with research vessels and staff dedicated solely to these assessments. Therefore, they are uncommon in many small-scale fisheries, including coral reef fisheries, due to lack of funding and limited institutional capacity of local agencies to collect and analyze the data. ref
The information presented here describes a variety of stock assessment methods, focusing on those that can be applied with minimal data.
Stock Assessment Methods for Coral Reef Fisheries
Methods listed are in order of quantity and quality of data required from low (PSA) to high (Surplus Production). Data requirements, outputs, and caveats vary depending on referenced methodologies used.| Type of Assessment Method | Possible Data Requirements | Outputs | Caveats |
|---|---|---|---|
| PSA: Productivity and Susceptibility Analysis ref | Life history information Spatial area and selectivity of the fishery | Susceptibility, productivity, vulnerability index; does not directly inform status | Requires moderate capacity |
| RAPFISH: A rapid appraisal technique to evaluate the sustainability status of fisheries ref | Knowledge of ecological, economic, ethical, social, and technological attributes | Sustainability score; does not directly inform status | Requires moderate capacity |
| No-take marine reserve-based methods ref | Fish density (or CPUE from scientific surveys) inside and outside reserve Length frequency inside and outside of reserve Life history information | Relative density; indicates whether or not fishing effort is sustainable | Assumes reserves are well-enforced and conditions inside represent an unfished population |
| Length-based methods ref | Length data Life history information | Fishery status relative to (proxy) reference points and/or trends; indicates whether or not catches are sustainable | Assumes length data from the catch are representative of the stock, may assume constant recruitment and fishing effort; may present biased estimates for species that aggregate and change sex |
| Decision Trees and Traffic Lights ref | Empirical data (e.g. lengths, landings, effort) Life history information | Recommended adjustments to management measures (e.g., ± allowable catch); indicates whether or not fishing effort is sustainable | Typically requires periodic evaluation |
| Visual census surveys ref | Fishery independent length frequency Life history information | Fishery status relative to MSY or MMSY reference point | Assumes species–habitat associations are a good indicator of species presence |
| Depletion analyses ref | CPUE Life history information | Fishery status relative to reference points; indicates whether fishing catch is sustainable | Assumes CPUE and catches are representative of the fishery; catchability of fish remains constant |
| Depletion-Corrected Average Catch (DCAC) ref Depletion-Based Stock Reduction Analysis (DB-SRA) ref | Historical catch (>10 years) Life history information | Estimates of sustainable yield; indicates whether or not catches are sustainable | Natural mortality rate should be <0.2; does not work well with highly depleted stocks |
| Surplus production models ref | CPUE | Fishery status relative to reference points; indicates whether or not catches are sustainable | Requires adequate contrast between CPUE and effort |
Stock Assessment Indicators
Fishery managers can use indicators and thresholds (i.e., reference points) to assess the status of a fishery in terms of its current biomass, reproductive capacity, and sustainability.
Determining which performance indicators and reference points to use requires managers to consider what data are available or obtainable given the social, ecological, and economic realities of the fishery and community. The determination of reference points also requires some understanding of how indicators may correspond to stock status.
Fishery Indicators and Reference Points
Performance indicators are measures of some attribute of the fishery, including quantitative and qualitative empirical indicators (e.g., mean size of fish in the catch), statistically derived indicators using a model (e.g., biomass estimated using a stock assessment model), proxy indicators for biomass (e.g., catch rates or density estimates) and fishing mortality (e.g., spawning potential ratios or length composition of the catch), or indirect indicators (e.g., increased travel time as an indication of declining local stocks).
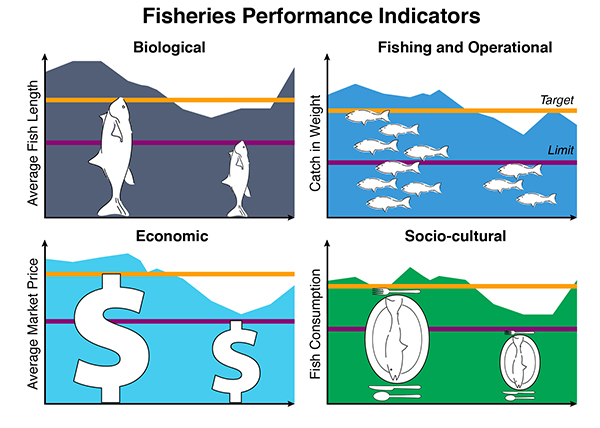
There are many ways to measure the social, biological, economic, and operational performance of a fishery. Fishery managers often use harvest control rules to indicate when and how much to adjust management when indicators change (for better or for worse). Managers aim to keep indicators at the Target Reference Points (orange). Harvest control rules typically become more restrictive if certain thresholds, such as Limit Reference Points (purple), are not being achieved.
Indicators need to be simple, easy to understand and measure, and should be developed collaboratively with fishery stakeholders such as fishers, resource managers, non-governmental organizations, and scientists. If possible, multiple performance indicators should be selected to provide a more complete understanding of the fishery. ref
Reference points are predetermined levels for indicators that allow for analysis of the relationship between performance indicators and the objectives of the fishery. There are typically two types of reference points: 1) a target reference point is an indicator value that corresponds to the condition of the fishery being at a desirable level; 2) a limit reference point is an indicator value that corresponds to the condition of the fishery being undesirable (e.g., overfished).
Resources
Coral Reef Fisheries Resource Library
Fishing for Solutions: A Fisheries Management Guidebook for Non-Fisheries Managers
A Guide to Fisheries Stock Assessment: From Data to Recommendations
Guide to Fisheries Science and Stock Assessments
Manual for Assessing Fish Stocks on Pacific Coral Reefs
Introduction to Tropical Fish Stock Assessment – Part 1: Manual