Introduction to Remote Sensing
Remote sensing and the application of different remote sensing coral reef mapping tools is the topic of the online course Remote Sensing and Mapping for Coral Reef Conservation. This three-lesson course helps marine managers understand and use remote sensing and mapping technologies – like the new Allen Coral Atlas – to guide and improve the effectiveness of reef management. In addition to English, the course is available in Spanish, French, and Bahasa Indonesia.
A second online course, Global Mangrove Watch introduces the Global Mangrove Watch platform and its data derived from remote sensing, including a global map of mangrove extent. This three-lesson course gives managers and policy makers the confidence to use the platform and its data for the conservation of mangroves.
Refer to these courses for more in-depth content on using remote sensing, and the Allen Coral Atlas and Global Mangrove Watch, for coral reef and mangrove conservation.
How is Remote Sensing Applied to Conservation?
Remote sensing has been used to support research in many fields such as tracking deforestation and illegal mining, monitoring shoreline changes, charting wildlife habitats, and tracking global temperatures. However, it is essential to understand the key concepts and the different approaches of remote sensing in order to choose the appropriate remote sensing data for your conservation plans and management decisions.
Example 1: Monitoring thermal stress on coral reefs at a global scale
The United States National Oceanic and Atmospheric Administration (NOAA) has developed the Coral Reef Watch Program based on satellite observation of daily measurements of sea surface temperature (SST). 95% of coral reefs are directly monitored daily. From these data, NOAA provides several products to inform managers of the risks of bleaching, including SST Anomaly, Coral Bleaching HotSpots, Degree Heating Weeks, and Bleaching Alert Area.
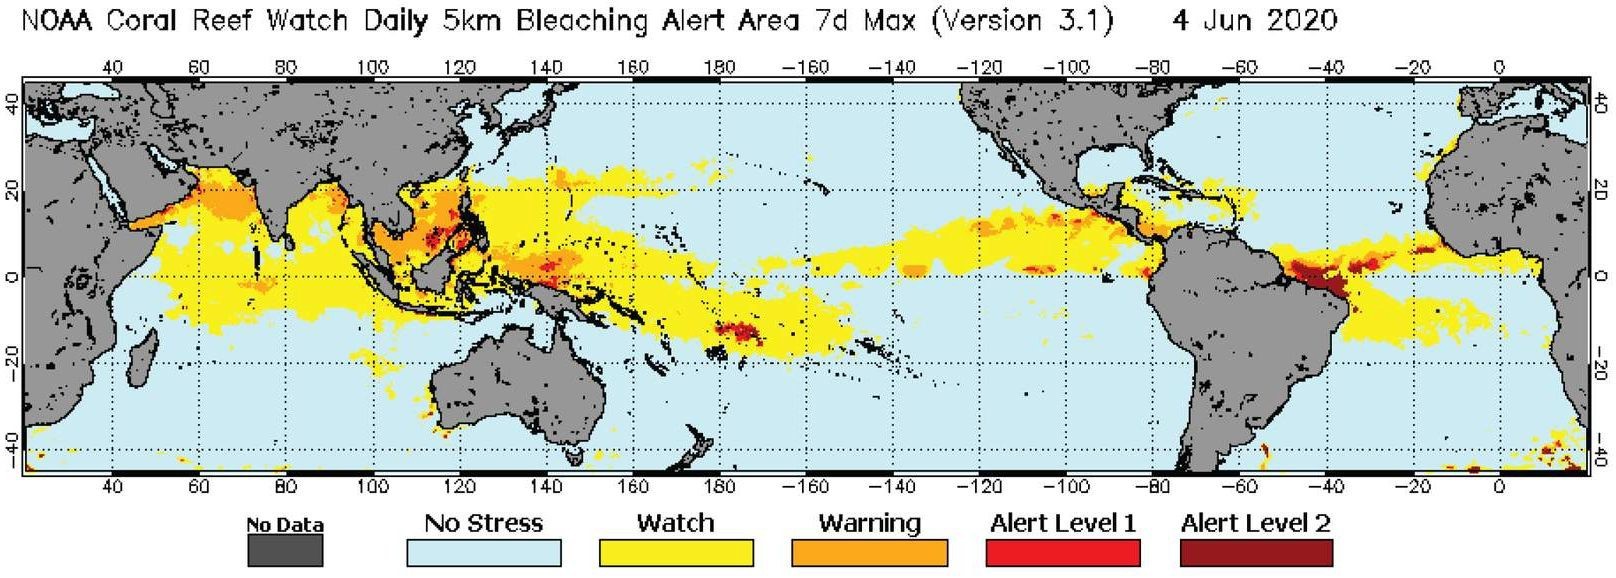
The Bleaching Alert Area map shows where coral bleaching heat stress currently reaches various levels. The Bleaching Alert Area data is based on satellite sea surface temperature monitoring. Image © NOAA Coral Reef Watch
Example 2: Mapping reef areas in 3D to estimate fish biomass and biodiversity
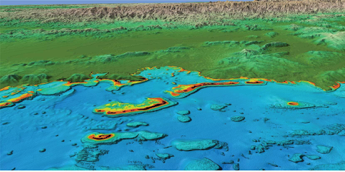
Image of seafloor 3D structure of coral reef. Image © Simon J. Pittman
The Stanford Center for Ocean Solutions used a remote sensing tool to better predict areas of high fish biomass and biodiversity. The technology called light detection and ranging (LiDAR) uses light in the form of a pulsed laser to measure variable distances. This allowed them to create 3D models, bringing to life the complexity of the coral reef seafloor. They combined these models with satellite imagery of the reef to identify areas of complex reef structure, and the populations of fish living within them.
Source: Wedding, L.M., et al. 2019. Remote Sensing of Three‐Dimensional Coral Reef Structure Enhances Predictive Modeling of Fish Assemblages. Remote Sensing in Ecology and Conservation 5: 150-159.